Showing posts with label math. Show all posts

Qui-binary arithmetic: how a 1960s IBM mainframe does math

The IBM 1401 computer uses an unusual technique called qui-binary arithmetic to perform arithmetic. In the early 1960s, the IBM 1401 was the most popular computer, used by many businesses for the low monthly price of $2500. For a business computer, error detection was critical: if a company sent out bad payroll checks because of a hardware fault, it would be catastrophic. By using qui-binary arithmetic, the IBM 1401 detects arithmetic errors.

If you've studied digital circuits, you've seen the standard binary adder circuits that add two numbers. But the IBM 1401 uses a totally different approach. Unlike modern computers, the IBM 1401 operates on decimal digits, not binary numbers, using BCD (binary-coded decimal). To add two numbers, digits are converted from BCD to qui-binary, added together with a special qui-binary adder, and then converted back to digits in BCD. This may seem pointlessly complex, but it allows easy error detection.

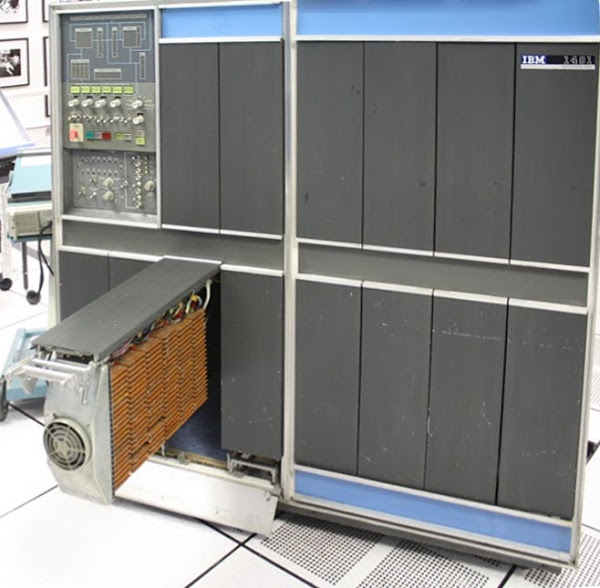
The photo below shows the IBM 1401 with one panel opened to show the addition/subtraction circuitry, made up of dozens of Standard Module System (SMS) cards. Each SMS card holds a simple circuit with a few germanium transistors (the computer predates silicon transistors). This article explains in detail how these circuits implement it.

The IBM 1401 mainframe with gate 01B3 opened. This gate contains the arithmetic circuitry, made up of many SMS cards.

The IBM 1401 mainframe with gate 01B3 opened. This gate contains the arithmetic circuitry, made up of many SMS cards.

What is qui-binary?

Qui-binary code is a way of representing a decimal digit with 7 bits. The number is split into a qui part (0, 2, 4, 6, or 8) and a binary part (0 or 1).[1] For example, 3 is split into 2+1, and 8 is split into 8+0. The qui part is labeled Q0, Q2, Q4, Q6, or Q8 and the binary part is B0 or B1. The number is then represented by seven bits: Q8Q6Q4Q2Q0B1B0. The following table summarizes the qui-binary representation.

DigitQuiBinary Bits: Q8Q6Q4Q2Q0B1B0
0Q0B00000101
1Q0B10000110
2Q2B00001001
3Q2B10001010
4Q4B00010001
5Q4B10010010
6Q6B00100001
7Q6B10100010
8Q8B01000001
9Q8B11000010

The advantage of qui-binary is error detection, since it is straightforward to detect an invalid qui-binary number.[2] A valid qui-binary number has exactly one qui bit and exactly one binary bit. Any other qui-binary number is faulty. For instance, Q4 Q2 B0 is bad, as is Q8. A problem in any bit creates a bad qui-binary number and can be detected.

Overview of the 1401's qui-binary circuit

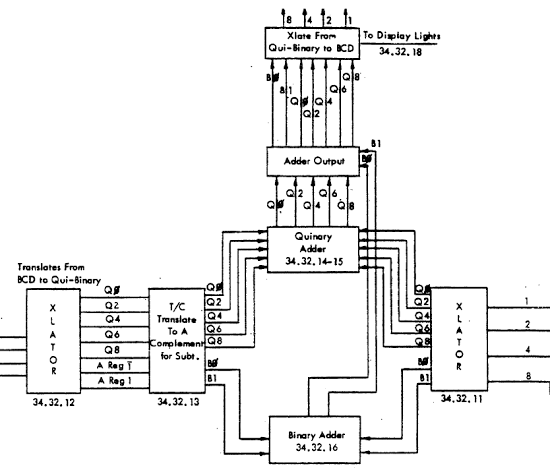
The IBM 1401's arithmetic unit operates on one digit at a time, adding them with a qui-binary adder.[3] The block diagram below[4] shows how the adder takes two binary-coded decimal digits, stored in the A and B temporary registers, and produces their sum. The digit from the A register enters on the left, and is translated to qui-binary by the translation circuit (labeled XLATOR). This qui-binary value goes through a translate/complement circuit which is used for subtraction. The digit in the B register enters on the right and is also converted to qui-binary. The binary bits (B0/B1) are added by the binary adder at the bottom. The quinary values are added with a special quinary adder. The adder output circuit combines the quinary bits with any carry, generating the qui-binary result. Finally, the translation circuit at the top converts the qui-binary result back to a BCD digit, sending the BCD value to core memory and to the console display lights.[5]

Overview of the arithmetic unit in the IBM 1401 mainframe.

Overview of the arithmetic unit in the IBM 1401 mainframe.

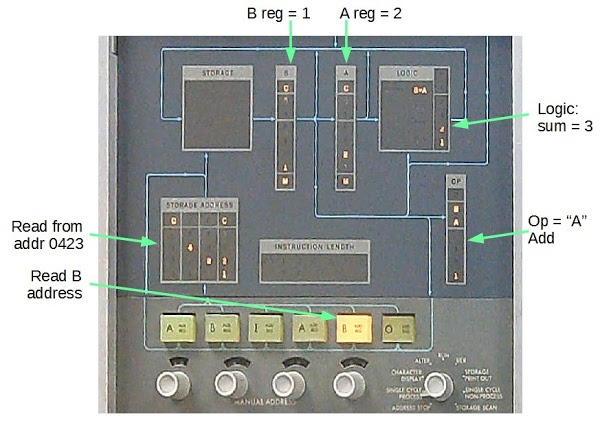
The photo below shows the IBM 1401 console during an addition instruction. The numbers are displayed in binary-coded decimal; the qui-binary representation is entirely hidden from the programmer. At this point in the addition instruction, the digit 1 was read from address 423 into the B register, and is added to the digit 2 already in the A register. The result from the qui-binary adder is 3 (binary 2 + 1), which is stored back to memory.[6]

The IBM 1401 console, showing an addition operation.

The IBM 1401 console, showing an addition operation.

BCD to qui-binary translation

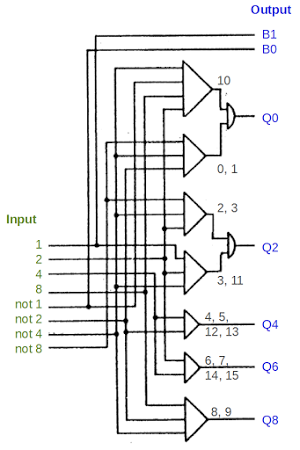
To examine the addition/subtraction circuitry in more detail, we'll start with the logic that converts a BCD digit to qui-binary. The logic is implement with an AND-OR structure that is common in the 1401. Note that the logic gate symbols are different from modern symbols: an AND gate is represented as a triangle, and an OR gate is represented as a semi-circle. Each bit of the BCD digit, as well as the bit's complement, is provided as input. Each AND gate matches a specific bit pattern, and then the results are combined with an OR gate to generate an output.

The circuit in an IBM 1401 mainframe to translate a BCD digit into qui-binary code.

The circuit in an IBM 1401 mainframe to translate a BCD digit into qui-binary code.

To see how this works, look at the AND gate at the bottom (labeled 8, 9). Tracing the wires to the inputs, this gate will be active if input 8 AND input not-4 AND input not-2 are set, i.e. if the input is binary 1000 or 1001. Thus, output Q8 will be set if the input digit is 8 or 9, just as required for the qui-binary code.

For a slightly more complicated case, the first AND gate matches binary 1010 (decimal 10), and the second AND gate matches binary 000x (decimal 0 or 1). Thus, Q0 will be set for inputs 0, 1, or 10. Likewise, Q2 is set for inputs 2, 3, or 11. The other Q outputs are simpler, computed with a single AND gate.[7]

The B0 and B1 outputs are simply wires from the not-1 and 1 inputs. If the input is even, B0 is set, and if the input is odd, B1 is set.

9's complement circuit

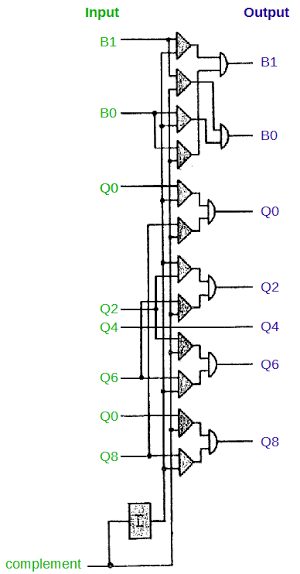
To perform subtraction, the IBM 1401 adds the 9's complement of the digit. The 9's complement is simply 9 minus the digit. The complement circuit below passes the qui-binary number through unchanged for addition or complemented for subtraction.[8] The complement input selects which mode to use; it is generated from the operation (addition or subtraction), and the signs of the input numbers.

To see how complementation works in qui-binary, consider 3 (Q2 B1). Its complement is 6 (Q6 B0). The general pattern for complementation is B0 and B1 get swapped. Q0 and Q8 are swapped, and Q2 and Q6 are swapped. Q4 is unchanged; for example, 4 (Q4 B0) is complemented to 5 (Q4 B1).[9]

The complement circuit from the IBM 1401 mainframe. This converts a digit to its 9's complement value.

The complement circuit from the IBM 1401 mainframe. This converts a digit to its 9's complement value.

Quinary adder

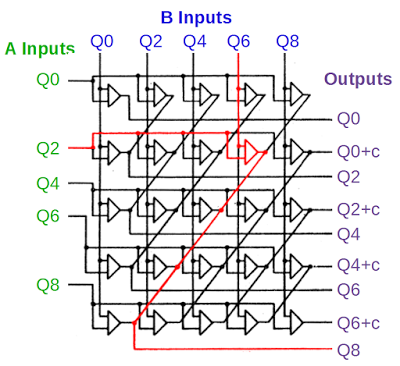
The circuit below adds the quinary parts of the two numbers and can be considered the "meat" of the adder. The qui part from the A register is on the left, the qui part from the B register is on the top, and the qui output is on the right. The outputs with "+c" indicate a carry if the result is 10 or more. The addition logic is implemented with a "brute force" matrix, connecting each pair of inputs to the appropriate output. An example is Q2 + Q6, shown in red. If these two inputs are set, the indicated AND gate will trigger the Q8 output.[10]

The quinary addition circuit in the IBM 1401 mainframe. This adds the quinary parts of two qui-binary digits. Highlighted in red is the addition of Q2 and Q6 to form Q8.

The quinary addition circuit in the IBM 1401 mainframe. This adds the quinary parts of two qui-binary digits. Highlighted in red is the addition of Q2 and Q6 to form Q8.

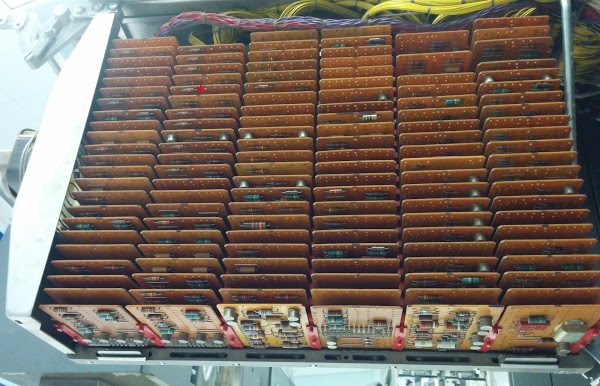
In the photo below, we can find the exact card in the IBM 1401 that performs this addition. The card in the upper left marked with a red asterisk computes the output Q8.[11]

The SMS cards in the IBM 1401 that perform arithmetic.

The SMS cards in the IBM 1401 that perform arithmetic.

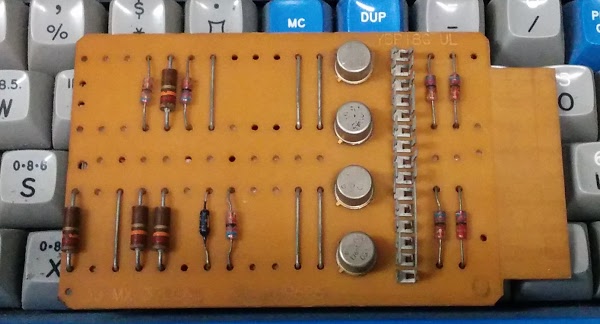
The circuitry in the IBM 1401 is simple enough that you can follow it all the way to the function of individual transistors.[12] The asterisk-marked card is a 3JMX SMS card containing 4 AND gates, and is shown below. Each of the round metal transistors corresponds to one AND gate for one of the sums that generates the output Q8. The top transistor is activated by inputs 8+0, the next for 0+8, the next 6+2, and the bottom one 2+6. Thus, the bottom transistor corresponds to the red AND gate in the schematic above.[13]

The SMS card of type 3JMX has four AND gates.

The SMS card of type 3JMX has four AND gates.

Qui-binary to BCD translation

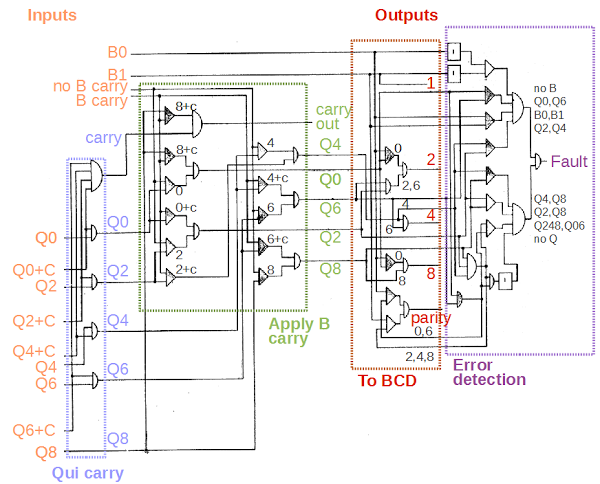
The diagram below shows the remainder of the qui-binary adder, which combines the qui and binary parts of the output, converts the output back to BCD, and detects errors. I'll just give an overview here, with more explanation in the footnotes.[14] The qui-binary carry circuit, in the blue box, processes the carry signals from the adder circuit. The next circuit, in the green box, applies any carry from the B bits, incrementing the qui component if necessary. The translation circuit, in red, converts the qui-binary result to BCD, using AND-OR logic. It also generates the parity output used for error detection in memory. The final circuit, in purple, is the error detection circuit which verifies the qui-binary result is valid and halts the computer if there is a fault.

The circuitry in the IBM 1401 mainframe to convert a qui-binary sum to a BCD result.

The circuitry in the IBM 1401 mainframe to convert a qui-binary sum to a BCD result.

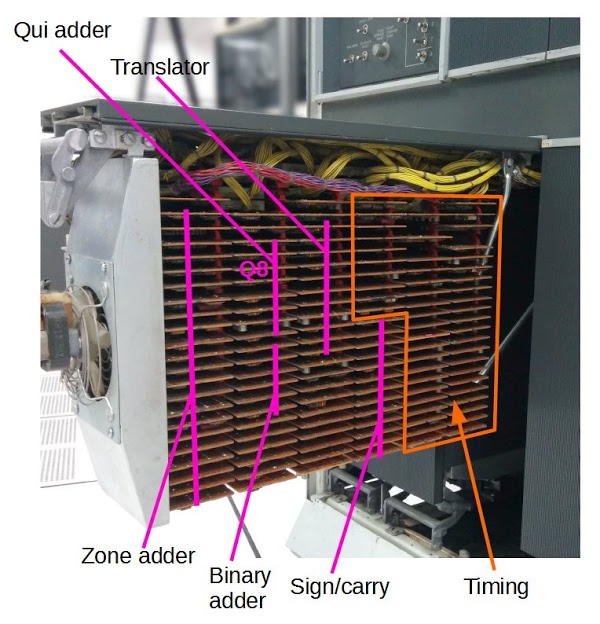
The photo below shows the functions of the different cards in the arithmetic rack.[15] The cards in the left half perform arithmetic operations. Each function takes multiple cards, since a single SMS card has a small amount of circuitry. "Q8" indicates the card discussed earlier that computes Q8. The right half is taken up with clock and timing circuits, which generate the clock signals that control the 1401.

This rack of circuitry in the IBM 1401 contains arithmetic logic (left) and timing circuitry (right).

This rack of circuitry in the IBM 1401 contains arithmetic logic (left) and timing circuitry (right).

Conclusion

This article has discussed how the 1401 adds or subtracts a single digit. The complete addition/subtraction process in the 1401 is even more complex because the 1401 handles numbers of arbitrary length; the hardware loops over each digit to process the entire numbers.[16][17]

Studying old computers such as the IBM 1401 is interesting because they use unusual, forgotten techniques such as qui-binary arithmetic. While qui-binary arithmetic seems strange at first, its error-detection properties made it useful for the IBM 1401. Old computers are also worth studying because their circuitry can be thoroughly understood. After careful examination, you can see how arithmetic, for instance, works, down to the function of individual transistors.

Thanks to the 1401 restoration team and the Computer History Museum for their assistance with this article. The IBM 1401 is regularly demonstrated at the Computer History Museum, usually on Wednesdays and Saturdays (schedule), so check it out if you're in Silicon Valley.

Notes and references

[1] Qui-binary is the opposite of bi-quinay encoding used in abacuses and old computers such as the IBM 650. In bi-quinary, the bi part is 0 or 5, and the quinary part is 0, 1, 2, 3, or 4.

[2] You might wonder why IBM didn't just use parity instead of qui-binary numbers. While parity detects bit errors, it doesn't work well for detecting errors during addition. There's no easy way to figure out what the parity should be for a sum.

[3] The IBM 1401 has hardware to multiply and divide numbers of arbitrary length. The multiplication and division operations are based on repeated addition and subtraction, so they use the qui-binary addition circuit, along with qui-binary doublers.

[4] The logic diagrams are all from the 1401 Instructional Logic Diagrams (ILD). Pages 25 and 26 show the addition and subtraction logic if you want to see the diagrams in context.

[5] The IBM 1401 performs operations on memory locations and the A and B registers provide temporary storage for digits as they are read from core memory. They are not general-purpose registers as in most microprocessors.

[6] A few more details about the console display. The "C" bit at the top of each register is the check (parity) bit used for error detection. The 1401 uses odd parity, so if an even number of bits are set, the C bit is also set. The "M" bit at the bottom is the word mark, which indicates the end of a variable-length field. The machine opcode character is zone B + zone A + 1, which indicates the letter "A".

Unlike modern computers, the 1401 uses intuitive opcodes so "A" means add, "S" means subtract, "B" means branch and so forth. (This is the actual opcode in memory, not the assembly mnemonic.) In the lower right, the mode knob is set to "Single cycle process", which allowed me to step through the instruction to get this picture. Normally this knob is set to "Run" and the console flashes frantically as instructions are executed.

[7] One surprising feature of the BCD translator is that it accepts binary inputs from 0 to 15, not just "valid" inputs 0 to 9. Input 10 is treated as 0, since the 1401 stores the digit 0 as decimal 10 in core. Values 11 through 15 are treated as 3 through 7. Thus, every binary input results in a valid (but probably unexpected) qui-binary value. As a result, the 1401 can perform addition on non-decimal characters, but the results aren't very useful.

[8] The IBM 1401 uses 9's complements since it is a decimal machine, unlike modern binary computers which use 2's complements. For example, the complement of 1 is 8, and the complement of 4 is 5. To subtract a number, the 9's complement of each digit is added (along with a carry). An example of using complements for subtration is 432 - 145. The 9's complement of 145 is 854. 432 + 854 + 1 = 1287. Discarding the top digit yields the desired result 432 - 145 = 287. Complements are explained in more detail in Wikipedia.

[9] If you trace through the AND-OR logic in the complement circuit, you can see that each pair of AND gates and and OR gate forms a multiplexer, selecting one input or the other. For example for the B1 output: if complement is 0 AND B1 is 1, the output is 1. OR, if complement is 1 AND B0 is 1, the output is 1. In other words, the output matches the B1 input if complement is 0, and matches the B0 input if complement is 1. The box labeled I in the schematic is an inverter.

[10] The quinary adder is implemented using wired-OR logic. Instead of an explicit OR gate, the AND outputs are simply wired together to produce the OR output. While the quinary adder looks symmetrical and regular in the schematic, its implementation uses three different SMS cards: 3JMX and 4JMX AND/OR gates, and JGVW AND gates, depending on the number of AND gates feeding the output.

[11] One component of interest in the photo of SMS cards is the silver rectangle on the lower right card. This is the quartz crystal that generates timing for the 1401. The SMS card is type RK, and the crystal runs the 347.5kHz oscillator. Eight oscillator half-cycles make up the 11.5 microsecond cycle time of the 1401. At the top of the photo are the wiring bundles connecting these circuits to other parts of the computer.

[12] Due to the simplicity of the IBM 1401 compared to modern computers, it's possible to understand how the IBM 1401 works at every level all the way to quantum physics. I'll give an outline here. The gates in an SMS card use a simple form of logic called CTDL by IBM and DTL (Diode-Transistor Logic) by the rest of the world. The 3JMX card schematic shows that each input is connected through a diode to the output transistor. If any input is high, current flows through the diode and turns off the transistor. The result is an AND gate (with inverted inputs). IBM Transistor Component Circuits (page 108) explains this circuit in detail.

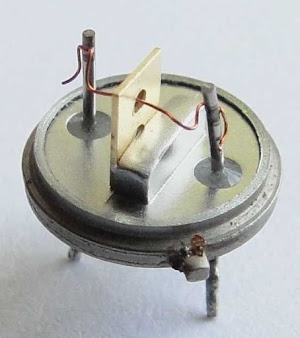
Going deeper, we can look inside the transistor. The board uses type 034 germanium alloy-junction transistors (details, details), very different from modern silicon-based planar transistors. These transistors consist of a germanium crystal base with indium beads fused on either side to form the emitter and collector. The regions of germanium-indium alloy form the "P" regions. In the photo, the germanium disk is in the small circular hole. Copper wires are connected to the indium beads. The photo below shows an IBM 083 transistor from the IBM 1401. This is the NPN version of the transistors in the 3JMX card. If you want a deeper understanding, look at bipolar junction transistor theory, which in turn is explained by quantum physics and solid-state device theory.

Inside a germanium alloy-junction transistor used in the IBM 1401 computer. This is an IBM 083 NPN transistor. Photo from http://ibm-1401.info/GermaniumAlloy.html

Inside a germanium alloy-junction transistor used in the IBM 1401 computer. This is an IBM 083 NPN transistor. Photo from IBM 1401 restoration team.

[13] You may wonder how 8=4+4 gets computed, since the card described doesn't handle that. The sum 4+4 is computed by the card just below the asterisk (a triple AND gate card of type JGVW). The other two AND gates in that card compute 6+6 and 8+8. To determine what each board in the IBM 1401 does, look at the Automated Logic Diagrams, page 34.32.14.2.

[14] The qui-binary carry logic happens in several phases. The qui parts are added, generating a carry if needed. The binary parts are added with a simple binary adder (not shown). A carry from the binary part shifts the qui part by 2. A carry out signal is also generated as needed. For instance, adding 3 + 5 is done by adding Q2 B1 + Q4 B1. This generates Q6 + B0 + B carry. The B carry increments the qui component to Q8, yielding the result Q8 B0 (i.e. 8).

The qui-binary to BCD translation circuit uses straightforward AND-OR logic, detecting the various combinations. Note that 0 is represented in the 1401 as binary 1010 (because binary 0000 indicates a blank), so the BCD output bits 8 and 2 are set for qui-binary value Q0 B0. The parity output is generate by combining the binary parity (even for B0; odd for B1) with the qui parity value. The qui even parity signal is set for Q0 or Q6, while the qui odd parity signal is set for Q2, Q4, Q8. Note that representing 0 as binary 1010 instead of 0000 doesn't affect the parity.

The error detection circuit uses AND-OR logic to detect bad qui-binary results. It detects a fault if no B bits are set or both B bits are set. Instead of testing every qui bit combination, it implements a short cut from the qui parity circuit. If the even qui parity signal and the odd qui parity signal are both set, this indicates multiple qui lines are set, triggering a fault. If neither qui parity signal is set, then no qui lines are set, also triggering a fault. The parity check misses a few qui combinations (such as Q0 and Q6 set), so these are tested separately. The result is that any invalid qui-binary result triggers a fault.

[15] The rack of cards shown is officially known as gate 01B3. The functions assigned to each card in the photo are approximate, because some cards are used by multiple functions. For exact information, see the plug list, which specifies the card type and function for every card in the 1401.

[16] One complication with the 1401's arithmetic instructions are numbers are stored as a positive value with a sign bit (on the last digit). This format makes printing of positive and negative numbers simpler, which is important for a business computer, but it makes arithmetic more complicated. First, the signs must be checked to determine if the numbers are being added or subtracted. Next, each digit is added or subtracted in sequence until the end of the number is reached. If the result is negative, the 1401 flips the result sign and converts the answer back to a positive value by making two additional digit-by-digit passes over the number. Modern computers use binary and handle negative numbers with two's complement, which makes subtraction much simpler. It takes 9 pages of documentation to explain the addition operation, complete with multiple flowcharts: see IBM 1401 Data Flow pages 24-32. (Keep in mind that these flowcharts are implemented in hardware, not with microcode or subroutines.)

[17] Arithmetic on the 1401 and the qui-binary adder are discussed in detail in 1401 Instruction Logic, pages 49-67. For the history leading up to qui-binary arithmetic, see this article by Carl Claunch.
Mining Bitcoin with pencil and paper: 0.67 hashes per day

I decided to see how practical it would be to mine Bitcoin with pencil and paper. It turns out that the SHA-256 algorithm used for mining is pretty simple and can in fact be done by hand. Not surprisingly, the process is extremely slow compared to hardware mining and is entirely impractical. But performing the algorithm manually is a good way to understand exactly how it works.

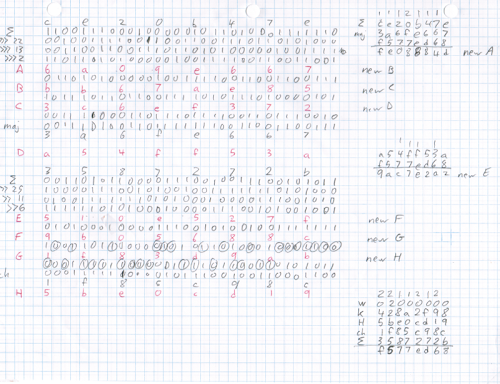
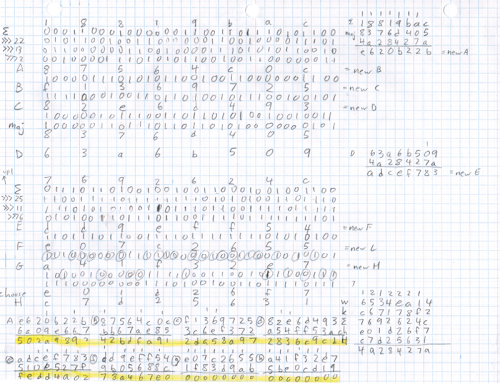
A pencil-and-paper round of SHA-256

A pencil-and-paper round of SHA-256

The mining process

Bitcoin mining is a key part of the security of the Bitcoin system. The idea is that Bitcoin miners group a bunch of Bitcoin transactions into a block, then repeatedly perform a cryptographic operation called hashing zillions of times until someone finds a special extremely rare hash value. At this point, the block has been mined and becomes part of the Bitcoin block chain. The hashing task itself doesn't accomplish anything useful in itself, but because finding a successful block is so difficult, it ensures that no individual has the resources to take over the Bitcoin system. For more details on mining, see my Bitcoin mining article.

A cryptographic hash function takes a block of input data and creates a smaller, unpredictable output. The hash function is designed so there's no "short cut" to get the desired output - you just have to keep hashing blocks until you find one by brute force that works. For Bitcoin, the hash function is a function called SHA-256. To provide additional security, Bitcoin applies the SHA-256 function twice, a process known as double-SHA-256.

In Bitcoin, a successful hash is one that starts with enough zeros.[1] Just as it is rare to find a phone number or license plate ending in multiple zeros, it is rare to find a hash starting with multiple zeros. But Bitcoin is exponentially harder. Currently, a successful hash must start with approximately 17 zeros, so only one out of 1.4x10²⁰ hashes will be successful. In other words, finding a successful hash is harder than finding a particular grain of sand out of all the grains of sand on Earth.

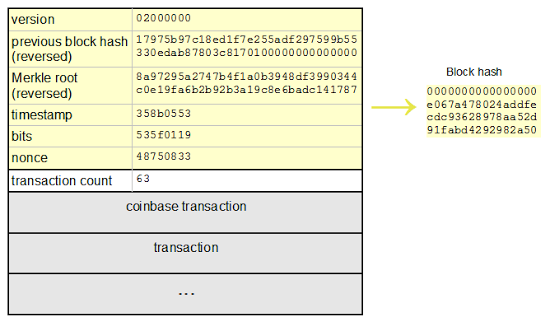
The following diagram shows a block in the Bitcoin blockchain along with its hash. The yellow bytes are hashed to generate the block hash. In this case, the resulting hash starts with enough zeros so mining was successful. However, the hash will almost always be unsuccessful. In that case, the miner changes the nonce value or other block contents and tries again.

Structure of a Bitcoin block

Structure of a Bitcoin block

The SHA-256 hash algorithm used by Bitcoin

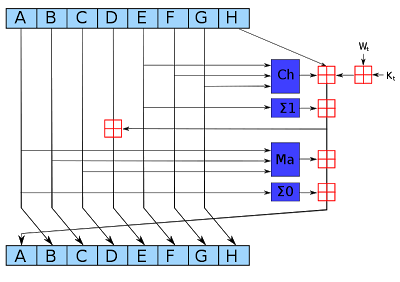
The SHA-256 hash algorithm takes input blocks of 512 bits (i.e. 64 bytes), combines the data cryptographically, and generates a 256-bit (32 byte) output. The SHA-256 algorithm consists of a relatively simple round repeated 64 times. The diagram below shows one round, which takes eight 4-byte inputs, A through H, performs a few operations, and generates new values of A through H.

SHA-256 round, from Wikipedia

One round of the SHA-256 algorithm showing the 8 input blocks A-H, the processing steps, and the new blocks. Diagram created by kockmeyer, CC BY-SA 3.0.

The blue boxes mix up the values in non-linear ways that are hard to analyze cryptographically. Since the algorithm uses several different functions, discovering an attack is harder. (If you could figure out a mathematical shortcut to generate successful hashes, you could take over Bitcoin mining.)

The Ma majority box looks at the bits of A, B, and C. For each position, if the majority of the bits are 0, it outputs 0. Otherwise it outputs 1. That is, for each position in A, B, and C, look at the number of 1 bits. If it is zero or one, output 0. If it is two or three, output 1.

The Σ0 box rotates the bits of A to form three rotated versions, and then sums them together modulo 2. In other words, if the number of 1 bits is odd, the sum is 1; otherwise, it is 0. The three values in the sum are A rotated right by 2 bits, 13 bits, and 22 bits.

The Ch "choose" box chooses output bits based on the value of input E. If a bit of E is 1, the output bit is the corresponding bit of F. If a bit of E is 0, the output bit is the corresponding bit of G. In this way, the bits of F and G are shuffled together based on the value of E.

The next box Σ1 rotates and sums the bits of E, similar to Σ0 except the shifts are 6, 11, and 25 bits.

The red boxes perform 32-bit addition, generating new values for A and E. The input Wt is based on the input data, slightly processed. (This is where the input block gets fed into the algorithm.) The input Kt is a constant defined for each round.[2]

As can be seen from the diagram above, only A and E are changed in a round. The other values pass through unchanged, with the old A value becoming the new B value, the old B value becoming the new C value and so forth. Although each round of SHA-256 doesn't change the data much, after 64 rounds the input data will be completely scrambled.[3]

Manual mining

The video below shows how the SHA-256 hashing steps described above can be performed with pencil and paper. I perform the first round of hashing to mine a block. Completing this round took me 16 minutes, 45 seconds.

To explain what's on the paper: I've written each block A through H in hex on a separate row and put the binary value below. The maj operation appears below C, and the shifts and Σ0 appear above row A. Likewise, the choose operation appears below G, and the shifts and Σ1 above E. In the lower right, a bunch of terms are added together, corresponding to the first three red sum boxes. In the upper right, this sum is used to generate the new A value, and in the middle right, this sum is used to generate the new E value. These steps all correspond to the diagram and discussion above.

I also manually performed another hash round, the last round to finish hashing the Bitcoin block. In the image below, the hash result is highlighted in yellow. The zeroes in this hash show that it is a successful hash. Note that the zeroes are at the end of the hash. The reason is that Bitcoin inconveniently reverses all the bytes generated by SHA-256.[4]

Last pencil-and-paper round of SHA-256, showing a successfully-mined Bitcoin block.

Last pencil-and-paper round of SHA-256, showing a successfully-mined Bitcoin block.

What this means for mining hardware

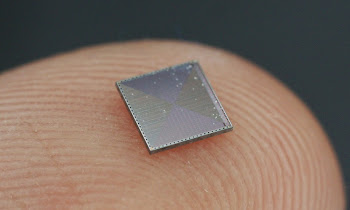
Each step of SHA-256 is very easy to implement in digital logic - simple Boolean operations and 32-bit addition. (If you've studied electronics, you can probably visualize the circuits already.) For this reason, custom ASIC chips can implement the SHA-256 algorithm very efficiently in hardware, putting hundreds of rounds on a chip in parallel. The image below shows a mining chip that runs at 2-3 billion hashes/second; Zeptobars has more photos.

The silicon die inside a Bitfury ASIC chip. This chip mines Bitcoin at 2-3 Ghash/second. Image from http://zeptobars.ru/en/read/bitfury-bitcoin-mining-chip (CC BY 3.0 license)

The silicon die inside a Bitfury ASIC chip. This chip mines Bitcoin at 2-3 Ghash/second. Image from Zeptobars. (CC BY 3.0)

In contrast, Litecoin, Dogecoin, and similar altcoins use the scrypt hash algorithm, which is intentionally designed to be difficult to implement in hardware. It stores 1024 different hash values into memory, and then combines them in unpredictable ways to get the final result. As a result, much more circuitry and memory is required for scrypt than for SHA-256 hashes. You can see the impact by looking at mining hardware, which is thousands of times slower for scrypt (Litecoin, etc) than for SHA-256 (Bitcoin).

Conclusion

The SHA-256 algorithm is surprisingly simple, easy enough to do by hand. (The elliptic curve algorithm for signing Bitcoin transactions would be very painful to do by hand since it has lots of multiplication of 32-byte integers.) Doing one round of SHA-256 by hand took me 16 minutes, 45 seconds. At this rate, hashing a full Bitcoin block (128 rounds)[3] would take 1.49 days, for a hash rate of 0.67 hashes per day (although I would probably get faster with practice). In comparison, current Bitcoin mining hardware does several terahashes per second, about a quintillion times faster than my manual hashing. Needless to say, manual Bitcoin mining is not at all practical.[5]

A Reddit reader asked about my energy consumption. There's not much physical exertion, so assuming a resting metabolic rate of 1500kcal/day, manual hashing works out to almost 10 megajoules/hash. A typical energy consumption for mining hardware is 1000 megahashes/joule. So I'm less energy efficient by a factor of 10^16, or 10 quadrillion. The next question is the energy cost. A cheap source of food energy is donuts at $0.23 for 200 kcalories. Electricity here is $0.15/kilowatt-hour, which is cheaper by a factor of 6.7 - closer than I expected. Thus my energy cost per hash is about 67 quadrillion times that of mining hardware. It's clear I'm not going to make my fortune off manual mining, and I haven't even included the cost of all the paper and pencils I'll need.

2017 edit: My Bitcoin mining on paper system is part of the book The Objects That Power the Global Economy, so take a look.

Follow me on Twitter to find out about my latest blog posts.

Notes

[1] It's not exactly the number of zeros at the start of the hash that matters. To be precise, the hash must be less than a particular value that depends on the current Bitcoin difficulty level.

[2] The source of the constants used in SHA-256 is interesting. The NSA designed the SHA-256 algorithm and picked the values for these constants, so how do you know they didn't pick special values that let them break the hash? To avoid suspicion, the initial hash values come from the square roots of the first 8 primes, and the Kt values come from the cube roots of the first 64 primes. Since these constants come from a simple formula, you can trust that the NSA didn't do anything shady (at least with the constants).

[3] Unfortunately the SHA-256 hash works on a block of 512 bits, but the Bitcoin block header is more than 512 bits. Thus, a second set of 64 SHA-256 hash rounds is required on the second half of the Bitcoin block. Next, Bitcoin uses double-SHA-256, so a second application of SHA-256 (64 rounds) is done to the result. Adding this up, hashing an arbitrary Bitcoin block takes 192 rounds in total. However there is a shortcut. Mining involves hashing the same block over and over, just changing the nonce which appears in the second half of the block. Thus, mining can reuse the result of hashing the first 512 bits, and hashing a Bitcoin block typically only requires 128 rounds.

[4] Obviously I didn't just have incredible good fortune to end up with a successful hash. I started the hashing process with a block that had already been successfully mined. In particular I used the one displayed earlier in this article, #286819.

[5] Another problem with manual mining is new blocks are mined about every 10 minutes, so even if I did succeed in mining a block, it would be totally obsolete (orphaned) by the time I finished.

Simulating a TI calculator with crazy 11-bit opcodes

I've built a register-level simulator of a 1974 TI calculator chip that shows what actually happens inside a calculator when you perform operations and shows the calculator source code as it executes. The architecture of the calculator chip is pretty interesting, with 11-bit opcodes, a 9-bit address bus, and 44-bit BCD registers. The chip doesn't support multiplication or division, so these are performed with repeated addition or subtraction.

The simulator is at righto.com/ti.

The 6502 overflow flag explained mathematically

The overflow flag on the 6502 processor is a source of myth and confusion. In this article, I explain signed and unsigned binary arithmetic, discuss the meaning of the overflow flag, show various formulas for computing overflow, and dispell some myths about the overflow flag.

You might be looking for my other article on overflow - The 6502 CPU's overflow flag explained at the silicon level - which is much more popular.

The 6502 is an 8-bit microprocessor that was very popular in the 1970s and 1980s, powering popular home computers such as the Apple II, Commodore PET, and Atari 400/800. The 6502 instruction set includes 8-bit addition and subtraction operations. Various status flags (carry, zero, negative, overflow) are set based on the result of the operation. Most of the flags (carry, zero, negative) are straightforward, but the meaning of the overflow (V) flag is harder to understand. If the result of a signed add or subtract won't fit into 8 bits, the overflow flag is set. (The overflag is affected in a couple other cases - the BIT operation, and the SO pin on the chip. These are discussed in detail in the excellent article The overflow flag explained, so I won't discuss them here.)

Addition on the 6502

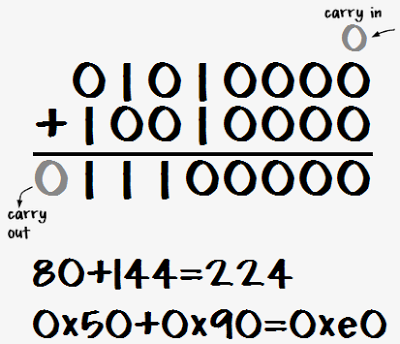
The 6502 has an 8-bit addition operation ADC (add with carry) which adds two numbers and a carry-in bit, yielding an 8-bit result and a carry out bit. The following diagram shows an example addition in binary, decimal, and hexadecimal.

Unsigned binary addition of 80 + 44 yielding 224.

The carry flag is used as the carry-in for the operation, and the resulting carry-out value is stored in the carry flag. The carry flag can be used to chain together multiple ADC operations to perform multi-byte addition.

Ones-complement and twos-complement

The concepts of ones-complement and twos-complement are important to understand signed arithmetic. The ones complement of a number simply flips all 8 bits in the number. That is, the ones complement of N is 255-N. This is very easy to do in hardware.

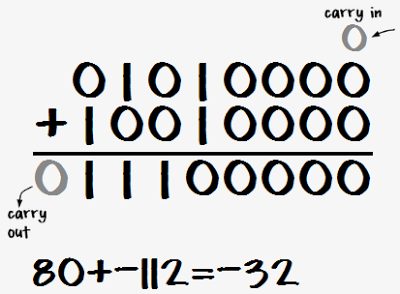
The twos complement of a number is the ones complement of the number plus 1. That is, the twos complement of N is 256-N. The twos complement is very useful because adding M and the twos complement of N is the same as subtracting N from M. For example, to compute 80 - 112, simply take the twos complement of 112 (binary 10010000) and add it to 80 (binary 01010000), yielding (binary 11100000). This result is the twos complement of 32, indicating -32.

Signed binary addition of 80 and -112 yielding -32.

Note that 80+144 and 80-112 had exactly the same bit-level operations - only the interpretation of the bits was different. This is why twos complement numbers are so useful - the same addition circuit works with them.

To see why twos complement numbers work this way, consider M + (-N) or M - N

M - N
→ M - N + 256Adding 256 doesn't change the 8-bit value.
= M + (256 - N)Simple algebra.
= M + twos complement of NDefinition of twos complement.

Thus, adding the twos complement is the same as subtracting. (With the exception of the carry bit, which is affected by the extra 256. This will be discussed later)

Twos-complement signed numbers

Twos complement numbers are very useful for representing signed numbers, since a number between -128 and +127 can fit into one byte: the top bit is 0 for a normal non-negative number (0 to 127), and the top bit is 1 for a twos-complement negative number (-1 to -128). (The value of the top bit is reflected in the N (negative) status flag.)

The nice thing about signed numbers is that regular binary arithmetic yields the expected results (in most cases). That is, the processor adds or subtracts the numbers as if they are unsigned binary numbers, and the right answer occurs just by interpreting them as signed.

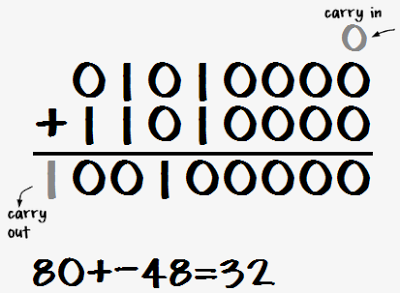
Another example shows that the carry is ignored with signed addition. In this case, 80 and -48 are added, yielding 32. Since 80 + (256-48) = 256 + (80-48), the "extra" 256 ends up in the carry bit.

Signed addition of 80 and -48 yields a carry, which is discarded.

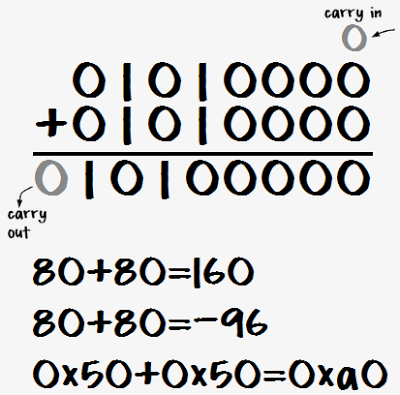
Unfortunately, problems can happen. For instance, 80 + 80 = 160 with unsigned arithmetic, but with signed arithmetic the result is unexpectedly -96. The problem is that 160 will fit into a byte as an unsigned number, but it is too big to store in a byte as a signed number. Since the top bit is set, it is interpreted as a negative number. To indicate this problem, the 6502 sets the overflow flag.

Signed addition of 80 + 80 yields overflow.

The table that explains everything about overflow

The definition of the 6502 overflow flag is that it is set if the result of a signed addition or subtraction doesn't fit into a signed byte. That is, overflow occurs if the result is > 127 or < -128. The symptom of this is adding two positive numbers and getting a negative result or adding two negative numbers and getting a positive result.

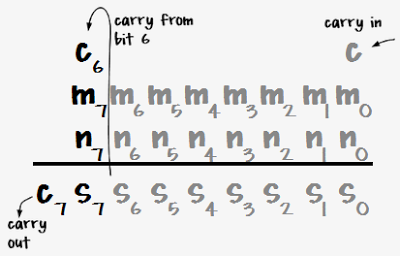
This section explores all the possible ways that overflow can occur. The following examples consider the addition of two signed numbers M and N. It is only necessary to consider the top bits of the numbers and the carry from bit 6, as shown in the diagram below, since the lower bits don't affect overflow (except by causing a carry from bit 6).

Binary addition, demonstrating the bits that affect the 6502 overflow flag.

There are 8 possibilities for these bits, as expressed in the table below. For each set of input bits, the table shows the carry out (C7), the top bit of the sum (S7), which is the sign bit, and the overflow bit V. This covers the 4 possibilities for sign of the arguments (positive + positive, positive + negative, negative + positive, negative + negative), with and without carry from bit 6. The table shows an example sum for each line, first expressed in hexadecimal, and then interpreted as unsigned addition and signed addition.

InputsOutputsExample
M7 N7 C6 C7 S7 VCarry / OverflowHexUnsignedSigned
000000No unsigned carry or signed overflow0x50+0x10=0x6080+16=9680+16=96
001011No unsigned carry but signed overflow0x50+0x50=0xa080+80=16080+80=-96
010010No unsigned carry or signed overflow0x50+0x90=0xe080+144=22480+-112=-32
011100Unsigned carry, but no signed overflow0x50+0xd0=0x12080+208=28880+-48=32
100010No unsigned carry or signed overflow0xd0+0x10=0xe0208+16=224-48+16=-32
101100Unsigned carry but no signed overflow0xd0+0x50=0x120208+80=288-48+80=32
110101Unsigned carry and signed overflow0xd0+0x90=0x160208+144=352-48+-112=96
111110Unsigned carry, but no signed overflow0xd0+0xd0=0x1a0208+208=416-48+-48=-96

A few interesting things can be noted from this table. Signed overflow (V=1) happens in two of the eight cases - when the result of adding two positive numbers overflows and ends up negative, and when the result of adding two negative numbers overflows and ends up positive. These rows are highlighted. Signed overflow will never happen when adding a positive number and a negative number, since the result will have a smaller magnitude. Unsigned carry (red in the unsigned column) happens in four of the eight cases, and is independent of signed overflow.

Formulas for the overflow flag

There are several different formulas that can be used to compute the overflow bit. By checking the eight cases in the above table, these formulas can easily be verified.

A common definition of overflow is V = C6 xor C7. That is, overflow happens if the carry into bit 7 is different from the carry out.

A second formula simply expresses the two lines that cause overflow: if the sign bits (M7 and N7) are 0 and the carry in is 1, or the sign bits are 1 and the carry in is 0:
V = (!M7&!N7&C6) | (M7&N7&!C6)

The above formula can be manipulated with De Morgan's laws to yield the formula that is actually implemented in the 6502 hardware:
V = not (((m7 nor n7) and c6) nor ((M7 nand N7) nor c6))

Overflow can be computed simply in C++ from the inputs and the result. Overflow occurs if (M^result)&(N^result)&0x80 is nonzero. That is, if the sign of both inputs is different from the sign of the result. (Anding with 0x80 extracts just the sign bit from the result.) Another C++ formula is !((M^N) & 0x80) && ((M^result) & 0x80). This means there is overflow if the inputs do not have different signs and the input sign is different from the output sign (link).

Subtraction on the 6502

The behavior of the overflow flag is fundamentally the same for subtraction, indicating that the result doesn't fit into the signed byte range -128 to 127. The 6502 has a SBC operation (subtract with carry) that subtracts two numbers and also subtracts the borrow bit. If the (unsigned) operation results in a borrow (is negative), then the borrow bit is set. However, there is no explicit borrow flag - instead the complement of the carry flag is used. If the carry flag is 1, then borrow is 0, and if the carry flag is 0, then borrow is 1. This behavior may seem backwards, but note that both for addition and subtraction, if the carry flag is set, the output is one more than if the carry flag is clear.

Defining the borrow bit in this way makes the hardware implementation simple. SBC simply takes the ones complement of the second value and then performs an ADC. To see how this works, consider M minus N minus borrow B.

M - N - BSBC of M and N with borrow B
→ M - N - B + 256Add 256, which doesn't change the 8-bit value.
= M - N - (1-C) + 256Replace B with the inverted carry flag.
= M + (255-N) + CSimple algebra.
= M + (ones complement of N) + C255 - N is the same as flipping the bits.

The following table shows the overflow cases for subtraction. It is similar to the previous table, with the addition of the B column that indicates if a borrow resulted. Unsigned operation resulting in borrow are shown in red, as are signed operations that result in an overflow.

InputsOutputsExample
M7 N7 C6 C7 BS7 VBorrow / OverflowHexUnsignedSigned
0100100Unsigned borrow but no signed overflow0x50-0xf0=0x6080-240=9680--16=96
0110111Unsigned borrow and signed overflow0x50-0xb0=0xa080-176=16080--80=-96
0000110Unsigned borrow but no signed overflow0x50-0x70=0xe080-112=22480-112=-32
0011000No unsigned borrow or signed overflow0x50-0x30=0x12080-48=3280-48=32
1100110Unsigned borrow but no signed overflow0xd0-0xf0=0xe0208-240=224-48--16=-32
1111000No unsigned borrow or signed overflow0xd0-0xb0=0x120208-176=32-48--80=32
1001001No unsigned borrow but signed overflow0xd0-0x70=0x160208-112=96-48-112=96
1011010No unsigned borrow or signed overflow0xd0-0x30=0x1a0208-48=160-48-48=-96

Comparing the above table with the overflow table for addition shows the tables are structurally similar if you take the ones-complement of N into account. As with addition, two of the rows result in overflow. However, some things are reversed compared with addition. Overflow can only occur when subtracting a positive number from a negative number or vice versa. Subtracting positive from positive or negative from negative is guaranteed not to overflow.

The formulas for overflow during addition given earlier all work for subtraction, as long as the second argument (N) is ones-complemented. Since internall subtraction is just addition of the ones-complement, N can simply be replaced by 255-N in the formulas.

Overflow myths

There are a lot of myths and confusion about the overflow flag. Since the flag is a bit difficult to understand, simple but wrong explanations are easy to find.

The most common myth is that just as the carry bit indicates a carry (or overflow) from bit 7, the overflow bit indicates a carry (or overflow) from bit 6 (example, example, example). As can be seen from the table above, sometimes a carry from bit 6 causes an overflow and sometimes it doesn't.

Another myth is that for multi-byte signed numbers, you use the overflow flag instead of the carry flag to carry from one byte to another (example). In fact, carry is still used to add/subtract multi-byte signed numbers, the same as with unsigned numbers.

It is sometimes claimed that the overflow bit is set if a result is too large to be represented in a byte (example, example). This omits the critical word signed - a signed result can be too large to fit in a byte, even if the unsigned result fits, and vice versa. Examples are in the table above.

Another confusing explanation is that the overflow flag is set when the sign bit is affected (example). The table shows that sometimes there is overflow when the sign bit is affected by bit 6 carry, and sometimes there is overflow when the sign bit is not affected.

Conclusions

This is probably more than anyone really wants to know about the overflow flag. In my next article, I discuss how overflow is implemented at the silicon level.

A new multi-branch algorithm to render rational-exponent Mandelbrot fractals: Part I

If you came here from Hacker News, thanks for visiting. You might want to check out the Hacker News comment thread too.

The Mandelbrot fractal is generated by repeatedly iterating the complex function f(z) = z^2 + c, and testing if the result diverges to infinity or not. An obvious generalization is to use a different exponent in place of 2 (yielding a fractal sometimes called the Multibrot). In this article, I describe a new algorithm for fractals with a rational exponent, for example z^2.5+c. This algorithm uses all branches of the complex roots in parallel, rather than just the principal root, which displays new structure of the fractal.

Previous techniques to display fractional-exponent fractals force the multi-valued complex root to have a single value, which distorts the "true" fractal. By computing all the possible root values in parallel, I determine the "true" form of the fractal.

The following image shows the multi-branch fractal for z^2.5+c. Click on the image (or any of the other images) for a full-size version.

The multi-branch fractal for z^2.5+c.

The multi-branch fractal for z^2.5+c.

The problem with square roots

Numbers generally have two square roots, although we typically only think about the principal (positive) one. For instance (-2)2 = 22 = 4, so sqrt(4) = +2 or -2. (Zero is the exception.) Likewise, complex numbers have two square roots. Unfortunately, we can't just pick one of the square roots without running into discontinuities. For instance, suppose we start with sqrt(1) = 1. Then look at sqrt(i), sqrt(-1), and sqrt(-i) on the following diagram. The roots are nice and continuous from (A) to (D) until we end up back at (E), where sqrt(1) = -1. Something has to give; somewhere the square root function is going to become discontinuous.
Square root of complex numbers
This problem can be solved by making a branch cut, where the function is discontinuous. This cut is typically along the negative real axis, so at point (C) the square root function would jump from i to -i. Note that cutting along the negative real axis is arbitrary.

The disadvantage of making the square root function discontinuous is the resulting fractatals will have discontinuities. In addition, the appearance of the fractal will change if the arbitrary cut is made in a different location. Thus, in a sense, if you generate a fractal based on z^2.5+c, you're not seeing the real fractal, but artifacts based on arbitrary decisions.

Multi-valued complex functions can be expressed as Riemann surfaces. Instead of being defined on the complex plane, the function is defined on a surface which locally looks like the complex plane, but can have more structure. For instance, the following illustration shows the Riemann surface for the complex square root. Note that for each point (except 0), there are two values for the square root.

A Riemann surface for the complex function f(z) = sqrt(z).

A Riemann surface for the complex function f(z) = sqrt(z).

ParametricPlot3D[{r * Cos[theta], r * Sin[theta], Sqrt[r] * Cos[theta/2]}, {theta, 0, 4Pi}, {r, 0, 5}, PlotPoints -> 100, PlotStyle->Opacity[.6], ViewPoint -> {-2, -2, 1}, Mesh->True, ColorFunctionScaling->False, ColorFunction -> Function[ {x,y,z,theta, r}, Hue[theta/(4Pi), .9, .9]]]

How do you compute a complex root?

In general, a complex power a^b is defined as exp(b * ln(a)), using the complex exponential and logarithm. The complex logarithm is multi-valued, which is the base of the multi-valued problems. These functions can be computed using well-known formulas.

Because I'm using square roots instead of arbitrary powers (for now), I can use a simpler complex square root formula (details at Wikipedia). The following code takes a complex number x + i * y, and returns the primary square root x1 + i * y1. Note that the negative -(x1 + i * y1) is the other square root.

public static void csqrt(double x, double y, ref double x1, ref double y1)
{
  double m = x * x + y * y;
  double r = Math.Sqrt(m);
  x1 = Math.Sqrt((r + x) / 2.0);
  if (y > 0) {
    y1 = Math.Sqrt((r - x) / 2.0);
  } else {
    y1 = -Math.Sqrt((r - x) / 2.0);
  }
}

Generating the real fractal, with all the branches

The key idea of the multi-branch algorithm is instead of forcing the square root function to have a single arbitrary value, embrace the multi-valued nature of the square root and try both values. In this way, we can see the "true" picture of the fractional-exponent Mandelbrot set. Specifically, instead of taking one value for the square root, the algorithm evaluates the fractal recursively trying each square root in turn. The two return values are combined to yield the final result.

To generate the multi-branch fractal, we can test each point to see if any branch converges. However, the result is more interesting if we count how many of the branches converge for each pixel. The result can be anywhere between all of them (in the middle of the fractal) to none of them (outside the fractal).

To decide if a point diverges, I use the standard escape-time technique of checking if the magnitude of z exceeds a bound. If z exceeds the bound, I know the point diverges. If z doesn't exceed the bound by the end of the iterations, I assume it doesn't diverge. This is not necessarily true, which is why the accuracy of a fractal increases as the number of iterations increases. I test for divergence with a bound of magnitude^2 > 4; the exact value of the bound doesn't make much difference as long as it is large enough to guarantee divergence.

The following code shows how the number of convergent branches c is computed recursively. Note that (z25x, z25y) is one of the values of z^2.5, and (-z25x, -z25y) is the other. The key to the multi-branch fractal is that both paths are explored, rather than just one. For a particular pixel, eval(x, y, x, y, 0) is called and the the result is displayed with a suitable colormap.

int eval(double zx, double zy, double cx, double cy, int n)
{
  if (n == max)
  {
    return 1;
  }
  // zsquared is z^2, zroot is sqrt(z), z25 is z^2.5
  double zsquaredx = zx * zx - zy * zy;
  double zsquaredy = 2 * zx * zy;
  double zrootx = 0, zrooty = 0;
  CMath.csqrt(zx, zy, ref zrootx, ref zrooty);
  double z25x = zsquaredx * zrootx - zsquaredy * zrooty;
  double z25y = zsquaredx * zrooty + zsquaredy * zrootx;

  int c = 0;
  // Use the first root
  double newx1 =  z25x + cx;
  double newy1 =  z25y + cy;
  if (newx1 * newx1 + newy1 * newy1 < 4)
  {
    c += eval(newx1, newy1, cx, cy, n + 1);
  }

  // Use the second root
  double newx2 = -z25x + cx;
  double newy2 = -z25y + cy;
  if (newx2 * newx2 + newy2 * newy2 < 4)
  {
    c += eval(newx2, newy2, cx, cy, n + 1);
  }
  return c;
}

The multi-branch fractal is exponentially slow compared to regular escape time fractals. At each iteration, there are two choices of square root, with the consequence that we evaluate 2^n values at each pixel, rather than n with a normal escape-time fractal. Unfortunately, this makes computation very expensive. For a regular escape-time fractal, you might use an iteration depth of hundreds for each pixel. But for the multi-branch fractal, it gets very slow if you go above about 12 iterations.

The above algorithm provides detail of the "inside" of the multi-branch fractal. Note that there is a central region where every branch converges. This isn't too surprising, since if c is sufficiently small, z^2.5 will converge with either branch. Outside this region is a complex area where points just barely converge on some branches, and flipping the branch anywhere will make the point diverge. The eight "snowflake" buds are what I find most interesting; these are regions that diverge for almost all branches, but converge for the "right" branches.

The resulting fractal is obviously symmetric when reflected in the y axis or when rotated by 60 degrees. The proofs are straightforward . In comparison, the regular z^2.5+c fractal is not rotationally symmetric because of the effect of branch cuts.

I believe the multi-branch fractal is connected (unlike the regular z^2.5+c fractal), but I don't have a proof. Interestingly, the fractal has some holes (i.e. is not simply connected). I believe these happen where different branches overlap in such a way that they happen to leave gaps, but on a particular branch (whatever that means) the fractal does not have holes.

The best way to see the holes is to look at the "outside" of the fractal. Instead of counting how many branches converge, the code can be easily modified to determine the maximum number of iterations it takes for a branch to diverge. This is similar to the standard escape-time fractal algorithm with level sets approaching the fractal (except of course, it uses multiple branches). In the image below, you can see dark blue spots inside the fractal near the "snowflakes" that look like image noise. These are actually areas that are outside the fractal with complex structure.

The multi-branch fractal for z^2.5+c, showing details of the exterior.

The multi-branch fractal for z^2.5+c, showing details of the exterior.

Stepping through iteration-by-iteration

One way to understand the multi-branch fractal is to step through one iteration at a time. If we start with one iteration, there are two branches at each pixel. We see a central region that converges for both branches, and three lobes that converge only for one branch. Note that the boundary wraps around the center twice. Perhaps you can imagine this boundary on the Riemann surface at the top of the page.

The multi-branch fractal for z^2.5+c, showing the number of convergent branches after 1 iteration.

After two iterations, the structure is considerably more complex. Each point has four different branch possibilities, and can converge on 0 to 4 of the branches. The boundary now winds around 4 times on a more complex Riemann surface. Note that each boundary in the first image has split into two boundaries woven together - these are the two different branches for the second iteration.

The multi-branch fractal for z^2.5+c, showing the number of convergent branches after 2 iterations.

With three iterations, the rough shape of the multi-branch fractal is starting to appear.

 The multi-branch fractal for z^2.5+c, showing the number of convergent branches after 3 iterations.

The multi-branch fractal for z^2.5+c, showing the number of convergent branches after 3 iterations.
Jumping to 14 iterations, the fractal has achieved its basic shape. Note the rough shape of the central region that converges for all branches. It is surrounded by many chaotic stripes, where most of the branches converge, but a few diverge. There are three big regions that mostly converge to two-cycles, and three smaller regions that mostly converge to three-cycles. The snowflakes, which diverge for almost all branches, are now clearly visible.

The multi-branch fractal for z^2.5+c, showing the number of convergent branches after 14 iterations.

The multi-branch fractal for z^2.5+c, showing the number of convergent branches after 14 iterations.

Snowflakes and the Monkey's Paw

The "snowflakes" are made of a repeated motif that I call the "monkey's paw". Looking at one of these regions while increaing the number of iterations helps illustrate some of the structure of the fractal. After 3 iterations, a basic four-fingered "paw" is visible.

Multi-sheet z^2.5+c fractal at (-.90, 1.14): 3 iterations

Multi-sheet z^2.5+c fractal at (-.90, 1.14): 3 iterations
After one more iteration, each finger splits into a new four-fingered paw. If you follow the edge of the paw, you'll discover a complex topology that winds through the paws in the order 2, 4, 1, 3, and winds through the fingers of each paw in the same order. This helps to illustrate the complex geometry of the underlying Riemann surface, which is splitting in the middle of each paw. (I hope to generate a 3D image to make this clearer.)

Multi-sheet z^2.5+c fractal at (-.90, 1.14): 4 iterations

Multi-sheet z^2.5+c fractal at (-.90, 1.14): 4 iterations
After another iteration, each finger sprouts another new paw, and paws are starting to bud on the arms.

Multi-sheet z^2.5+c fractal at (-.90, 1.14): 5 iterations

Multi-sheet z^2.5+c fractal at (-.90, 1.14): 5 iterations
After 6 iterations, there are paws sprouting everywhere. There is also a stable region in the middle of the original paw that converges for most of the branches.

Multi-sheet z^2.5+c fractal at (-.90, 1.14): 6 iterations

Multi-sheet z^2.5+c fractal at (-.90, 1.14): 6 iterations
Finally, jumping to 12 iterations, the paws have developed into "snowflakes", with five-fold branching (the four fingers plus the arm). The five-fold branching appears all over the fractal. In the middle of each paw is a stable rgion, which is roughly self-similar to the overall fractal. (Just like tiny Mandelbrots appear in the threads of the Mandelbrot set.)

Multi-sheet z^2.5+c fractal at (-.90, 1.14): 12 iterations

Multi-sheet z^2.5+c fractal at (-.90, 1.14): 12 iterations

Edge detection

Another way to see the structure is to filter the fractal to show the edges. This shows the structure of the boundary between convergent and divergent regions. The following image show the boundary after three iterations. If you follow the line around, you can see its complex structure.

Multi-sheet z^2.5+c fractal: edges of escape regions after 3 iterations.

Multi-sheet z^2.5+c fractal: edges of escape regions after 3 iterations.
After 5 iterations, the boundary has become very complex. Note the development of the "monkey's paws" discussed earlier. Also notice how many boundaries pass near the central region, causing the complexity there.

Multi-sheet z^2.5+c fractal: 5 iterations, edges of escape regions after 5 iterations.

Multi-sheet z^2.5+c fractal: 5 iterations, edges of escape regions after 5 iterations.

Comparison with the "regular" escape-time fractal

Comparing the multi-branch fractal with the single-branch fractal shows some interesting features. The image below is the fractal generated from z^2.5+c using the standard algorithm. Superficially, it looks a lot like the Mandelbrot set. However, note that it is not connected, with some unconnected islands in the upper center for example.
The regular escape-time fractal for z^2.5+c.
Zooming in on one of the "antennas" of the regular fractal illustrates more of the disconnected components. You can also see the discontinuities due to the branch cut, lines where the fractal gets cut off. There is also a somewhat self-similar region, in yellow.

Regular escape-time fractal at (-.82, 1.21)

Regular escape-time fractal at (-.82, 1.21)

Below is the same region of the fractal, displayed using the multi-branch algorithm. Note that there is much more detail provided by the multi-branch algorithm. Also note that the stable self-similar region looks very much like the overall multi-branch fractcal.

Multi-branch fractal at (-.82, 1.21)

Multi-branch fractal at (-.82, 1.21)

The regular fractal is actually a subset of the multi-branch fractal, since each computation in the single-branch fractal will be done in one of the paths of the multi-branch fractal. In the image below, the regular fractal has been overlayed on the multi-branch fractal. Note that the regular fractal exactly falls onto the multi-branch fractal, but is missing most of the branchess. Clicking on the image below will show an animation flipping between the regular fractal and the multi-branch fractal.

Overlay of regular escape-time and multi-branch fractals at (-.82, 1.21)

Overlay of regular escape-time and multi-branch fractals at (-.82, 1.21)

One surprising thing is how different the regular and multi-branch fractals look in general. The regular fractal looks much more "Mandelbrot-like" with its sequences of bulbs. I expect that the multi-branch fractal also has a similar structure, but hidden by the overlapping branches.

Another way of seeing how the fractals are related is to overlay the regular fractal with the edge map of the multi-branch fractal. In the following image, both fractals are rendered to a depth of 5 iterations. The regular fractal is displayed in cyan on top of the edges of the multi-branch fractal. Note that the edges match exactly, which is expected from the mathematics. Note also that the regular fractal jumps from curve to curve as it hits the branch cuts, rather than following a single curve. Also note how much of the multi-branch struture is missed by the regular fractal. (The regular fractal is very "blobby" because the iteration count is so low. A higher iteration could would make it too hard to see the edges.)

Multi-sheet z^2.5+c fractal: 5 iterations, edges of escape regions. Overlaid with regular z^2.5+c fractal.

Multi-sheet z^2.5+c fractal: 5 iterations, edges of escape regions. Overlaid with regular z^2.5+c fractal.

What's next?

There are many more things to explore with multi-branch fractals. The techniques can easily be extended to values other than 2.5. Rendering Julia sets instead of Mandelbrot sets is straightforward, but I haven't looked into that yet; it's just a matter of fixing c and varying z, instead of varying z.

A more interesting exploration is looking at the fractal in three dimensions. In particular, I want to examine the Riemann surface structure in more detail. I think separating out the sheets of the surface will expose much more of the fractal structure, which gets hidden when all the sheets are projected together. I tried to compute the Riemann surface for just two iterations of a similar function using Mathematica but the result is almost incomprehensible:

Riemann surce of (z^2+.z)^.5

Riemann surce of (z^2+.z)^.5
RiemannSurfacePlot3D[ w == (z^2.5+z)^.5, Re[w], {z, w}, PlotPoints -> {46, 44}, ImageSize -> 1260, Coloring -> Hue[Im[w]/8]]/. gc_GraphicsComplex :> {Opacity[0.66], gc} Multi-sheet z^2.5+c fractal at (-.90, 1.14): 5 iterations, edges of escape regions
An alternative way to compute the multi-branch fractal is to walk around the edge of the fractal. The result should be similar to the edge pictures above. However, walking pixel-by-pixel would have a few advantages. First, it would be much more efficient, allowing a much deeper iteration count which should show interesting fractal structure. Second, walking around only part of the edge will keep parts of the fractal from obscuring other parts.

I think the orbit behavior of individual starting points is a key to understanding this fractal. For instance, which starting points yield a 1-cycle, 2-cycle, and so forth. It's hard to define these cycles exactly, because of the multi-value nature of the fractal. A value can converge to a fixed point on one branch, but not another.

Another mathematical feature that I think is key to understanding the fractal is points where the value goes to zero. The function has many more zeros than I expected, and they are concentrated at "interesting" points of the fractal. The zeros are where the Riemann surfaces come together, and also the points where the boundary forms "loops".

I've been exploring different ways of displaying cycles and zeros, and hope to post images soon, but this post is already very long, so I'll leave those for Part II.

Related work

Many people have generated Mandelbrots with non-integer exponents, but always using a single-valued function. Wikipedia has a summary under the title Multibrot set.

I started investigating multi-branch fractional exponents many years ago but computers weren't powerful enough at the time, so my investigation didn't get very far. My negative integer exponents were easier to compute and I wrote a paper about those fractals: ``An Investigation of z -> 1/z^n+c,'' Computers & Graphics, 17(5), Sep. 1993, pp 603-607.

Joshua Sasmor has done an extensive investigation of non-integer exponents in his PhD thesis "Fatou, Julia and Mandelbrot Sets for Functions with Non-Integer Exponent" and in the paper "Fractals for functions with rational exponent", Computers and Graphics 28(4). Also of interest is his presentation Julia Set and Branch Cuts which shows the Julia set for z^2.5 - 1/2 + i/10 using inverse iteration instead of escape time. I suspect that his inverse iteration Julia set algorithm yields results similar to applying my multi-branch algorithm to Julia sets. I haven't explored this yet, but if true, it would provide more evidence that the multi-branch algorithm gives the "real" structure of the fratals.

There are several interesting videos that show the evolution of the generalized Mandelbrot set as the exponent changes. A few examples are Mandelbrot Set from 1 to 100 with zoom, Cut along negative X axis, and Cut along negative Y axis. It is interesting to compare the last two, to see how different the results are if the branch cut is placed in a different location.

Conclusion

The multi-branch algorithm provides an interesting new way to display Mandelbrot-like fractals that have non-integer exponents

The Mathematics of Volleyball

Recently I was at a multi-day volleyball tournament, which gave me plenty of time to ponder the mathematics of the game. At different points in the game, I'd wonder what the odds were of each team winning. And when a team gained or lost a point, I'd wonder how important that point was. Clearly, if the score was 24-24, gaining a point made a huge difference. But how much difference did getting one point at the beginning of the game matter? It seemed like it didn't matter much, but did it?

I decided to analyze the game mathematically. I made the simplifying assumption that each team had 50-50 odds of winning each point. I found the analysis interesting, and it turns out to have close ties to Pascal's Triangle, so I'm posting it here in case anyone else is interested.

Volleyball games are scored using the rally point system, which means that one team gets a point on every serve. (Back in the olden days, volleyball used side-out scoring, which meant that only the serving team could get a point. Fortunately, rally point scoring is more mathematically tractable. Rally point scoring also keeps the game advancing faster.) The winner of each match is the best out of three sets (a set is the same as a game). In the league I was watching, the winner of a game is the first team to get 25 points and be ahead by at least 2. (Except if a third tiebreaker game is needed, it only goes to 15 points instead of 25.)

A few cases are easy to analyze mathematically. If we assume each team has a 50-50 chance of scoring each point and the score is tied, each team obviously has a 50% chance of winning the game. (With side-out scoring, it makes a difference which team is serving, but for rally point scoring we avoid that complication.) The second obvious case is if a team has 25 points and the other team has 23 or fewer points, the first team has 100% chance of winning (since they already won).

I will use the notation P(m,n) for the chance of the first team wining if the score is m to n. From above, P(n, n) = 50%, P(25, n) = 100% for n <= 23, and P(m, 25) = 0% for m <= 23.

The chance of winning in other cases can be calculated from the assumption that a team has a 50% chance of winning the point, and a 50% chance of losing: the chance of winning is the average of these two circumstances. Mathematically, we get the simple recurrence:

For instance, if the score is 25-24, if the first team scores, they win. If the second team scores, then the score is tied. In the first (winning) case, the first team wins 100%, and in the second (tied) case, the first team wins 50%. Thus, on average they will win 75% of the time from a 25-24 lead. That is, P(25, 24) = 75%, and by symmetry P(24, 25) = 25%. (Surprisingly, these are the only scores where the requirement to win by 2 points changes the odds.)

Likewise, if the score is 24-23, half the time the first team will score a point and win, and half the time the second team will score a point and tie. So the first team has 1/2 * 100% + 1/2 * 50% = 75% chance of winning, and P(24, 23) = 75%.

More interesting is if the score is 24-22, half the time the first team will score a point and win, and half the time the second team will score, making the score 24-23. We know from above that the first team has a 75% chance of winning from 24-23, so P(24, 22) = 1/2 * 100% + 1/2 * 75% = 87.5%.

We can use the recurrence to work backwards and find the probability of winning from any score. The following table shows the probability of winning for each score. The first team has the score on the left, and the second team has the score on the top.

Table with odds of winning when the score is m to n

012345678910111213141516171819202122232425
050%44%39%33%28%23%18%14%11%8%5%4%2%1%1%0%0%0%0%0%0%0%0%0%0%0%
156%50%44%38%33%27%22%17%13%10%7%5%3%2%1%1%0%0%0%0%0%0%0%0%0%0%
261%56%50%44%38%32%27%21%17%13%9%7%4%3%2%1%1%0%0%0%0%0%0%0%0%0%
367%62%56%50%44%38%32%26%21%16%12%9%6%4%3%1%1%0%0%0%0%0%0%0%0%0%
472%67%62%56%50%44%37%31%26%20%16%11%8%6%4%2%1%1%0%0%0%0%0%0%0%0%
577%73%68%62%56%50%44%37%31%25%20%15%11%7%5%3%2%1%0%0%0%0%0%0%0%0%
682%78%73%68%63%56%50%43%37%30%24%19%14%10%7%4%3%1%1%0%0%0%0%0%0%0%
786%83%79%74%69%63%57%50%43%36%30%24%18%13%9%6%4%2%1%1%0%0%0%0%0%0%
889%87%83%79%74%69%63%57%50%43%36%29%23%17%12%8%5%3%2%1%0%0%0%0%0%0%
992%90%87%84%80%75%70%64%57%50%43%36%29%22%16%11%8%5%3%1%1%0%0%0%0%0%
1095%93%91%88%84%80%76%70%64%57%50%43%35%28%21%15%11%7%4%2%1%0%0%0%0%0%
1196%95%93%91%89%85%81%76%71%64%57%50%42%35%27%20%14%9%6%3%2%1%0%0%0%0%
1298%97%96%94%92%89%86%82%77%71%65%58%50%42%34%26%19%13%8%5%2%1%0%0%0%0%
1399%98%97%96%94%93%90%87%83%78%72%65%58%50%42%33%25%18%12%7%4%2%1%0%0%0%
1499%99%98%97%96%95%93%91%88%84%79%73%66%58%50%41%32%24%17%11%6%3%1%0%0%0%
15100%99%99%99%98%97%96%94%92%89%85%80%74%67%59%50%41%31%23%15%9%5%2%1%0%0%
16100%100%99%99%99%98%97%96%95%92%89%86%81%75%68%59%50%40%30%21%13%7%3%1%0%0%
17100%100%100%100%99%99%99%98%97%95%93%91%87%82%76%69%60%50%40%29%19%11%5%2%0%0%
18100%100%100%100%100%100%99%99%98%97%96%94%92%88%83%77%70%60%50%39%27%17%9%4%1%0%
19100%100%100%100%100%100%100%99%99%99%98%97%95%93%89%85%79%71%61%50%38%25%14%6%2%0%
20100%100%100%100%100%100%100%100%100%99%99%98%98%96%94%91%87%81%73%62%50%36%23%11%3%0%
21100%100%100%100%100%100%100%100%100%100%100%99%99%98%97%95%93%89%83%75%64%50%34%19%6%0%
22100%100%100%100%100%100%100%100%100%100%100%100%100%99%99%98%97%95%91%86%77%66%50%31%12%0%
23100%100%100%100%100%100%100%100%100%100%100%100%100%100%100%99%99%98%96%94%89%81%69%50%25%0%
24100%100%100%100%100%100%100%100%100%100%100%100%100%100%100%100%100%100%99%98%97%94%88%75%50%25%
25100%100%100%100%100%100%100%100%100%100%100%100%100%100%100%100%100%100%100%100%100%100%100%100%75%50%

Any particular chance of winning can be easily read from the table. For instance, if the score is 15-7, look where row 15 and column 7 meet, and you'll find that the first team has a 94% chance of winning. (This is P(15, 7) in my notation.)

The table illustrates several interesting characteristics of scores. The odds fall away from 50% pretty rapidly as you move away from the diagonal (i.e. away from a tied score). Points matter a lot more near the end of the game, though: you've only got a 1% chance of winning from an 18-24 position, while being six points behind at the beginning (0-6) still gives you an 18% chance of winning. However, a big deficit is almost insurmountable - if you're behind 0-15, you have less than a 1% chance of catching up and winning. (Note that 0% and 100% in the table are not exactly 0% and 100%, because there's always some chance to win or lose.)

Note that each score is the average of the score below and the score to the right - these are the cases where the first team gets the point and the second team gets the point. This corresponds directly to the equation above.

The table could be extended arbitrarily far if neither team gets a two point lead, but those cases are not particularly interesting.

Generating the score table with dynamic programming

To generate the table, I wrote a simple Arc program to solve the recurrence equation using dynamic programming:
(def scorePercent (s1 s2 max)
  (if (and (>= s1 max) (>= s1 (+ s2 2))) 100.
      (and (>= s2 max) (>= s2 (+ s1 2))) 0
      (is s1 s2) 50.
      (/ (+ (scorePercent s1 (+ s2 1) max)
            (scorePercent (+ s1 1) s2 max)) 2)))
The first two arguments are the current score, and the last argument is the amount to win (25 in this case). For instance:
arc> (scorePercent 24 22 25)
87.5
arc> (scorePercent 20 22 25)
22.65625
Unfortunately, the straightforward way of solving the problem has a severe performance problem. For instance, computing (scorePercent 5 7 25) takes hours and hours. The problem is that evaluating P(5, 7) requires calculating two cases: P(6, 7) and P(5, 8). Each of those requires two cases, each of which requires two cases, and so on. The result is an exponential number of evaluations, which takes a very very long time as the scores get lower. Most of these evaluations calculate the same values over and over, which is just wasted work. For instance, P(6, 8) is computed in order to compute P(6, 7) and P(6, 8) is computed again in order to compute P(5, 8).

There are a couple ways to improve performance. The hard way of solving the dynamic programming problem without this exponential blowup is to carefully determine an order in which each value can be calculated exactly once by working backwards, until you end up with the desired value. For instance, if the values are calculated going up the columns from right to left, each value can be computed immediately from two values that have already been computed, until we end up efficiently computing the whole table in approximately 25*25 steps. This requires careful coding to step through the table in the right order and to save each result as it is calculated. It's not too hard, but there's a much easier way.

The easy way of solving the problem is with memoization - when an intermediate value is calculated, remember its value in case you need it again, instead of calculating it over and over. With memoization, we can compute the results in any order we want, and automatically each result will only be computed once.

In Arc, memoization can be implemented simply by defining a function with defmemo, which will automatically memoize the results of the function evaluation:

(defmemo scorePercent (s1 s2 max)
  (if (and (>= s1 max) (>= s1 (+ s2 2))) 100.
      (and (>= s2 max) (>= s2 (+ s1 2))) 0
      (is s1 s2) 50.
      (/ (+ (scorePercent s1 (+ s2 1) max)
            (scorePercent (+ s1 1) s2 max)) 2)))
With this simple change, results are nearly instantaneous, rather than taking hours.

The above function generates a single entry in the table. To generate the full table in HTML with colored cells, I used a simple loop and Arc's HTML generating operations. If you're interested in Arc programming, the full code can be downloaded here.

Mathematical analysis

Instead of computing the probabilities through dynamic programming, it is possible to come up with a mathematical solution. After studying the values for a while, I realized rather surprisingly that the probabilities are closely tied to Pascal's Triangle. You may be familiar with Pascal's Triangle, where each element is the sum of the two elements above it (with 1's along the edges), forming a table of binomial coefficients:

Pascal's Triangle

Pascal's triangle

The game probabilities come from the triangle of partial sums of binomial coefficients, which is a lesser-known sequence that is easily derived from Pascal's Triangle. This sequence, T(n, k) is formed by summing the first k elements in the corresponding row of Pascal's Triangle. That is, the first element is the first element in the same row of Pascal's triangle, the second is the sum of the first two elements in Pascal's triangle, the third is the sum of the first three, etc.

T - the partial row sums of Pascal's Triangle

Partial row sums in Pascal's triangle
Mathematically, this triangle T(n, k) is defined by:


As with Pascal's Triangle, each element is the sum of the two above it, but now the right-hand border is powers of 2. This triangle is discussed in detail in the Online Encyclopedia of Integer Sequences. Surprisingly, this triangle is closely connected with distances in a hypercube, error-correcting codes, and how many pieces an n-dimensional cake can be cut into.

With function T defined above, the volleyball winning probabilities are given simply by:

For example, P(23,20) = T(6, 4)/2^6 = 89.0625%, which matches the table.

Intuitively, it makes sense that the probabilities are related to Pascal's Triangle, because each entry in Pascal's Triangle is the sum of the two values above, while each probability entry is the average of the value above and the value to the right in the table. Because taking the average divides by 2 in each step, an exponent of 2 appears in the denominator. The equation can be proved straightfowardly by induction.

The importance of a point

Suppose the score is m to n. How important is the next point? I'll consider the importance of the point to be how much more likely the team is to win the game if they win the point versus losing the point. For instance, suppose the score is 18-12, so the first team has a 92% chance of winning (from the previous table). If they win the next point, their chance goes up to 95%, while if they lose the point, their chance drops to 88%. Thus, we'll consider the importance to be 7%. Mathematically, if the score is m to n, I define the importance as P(m+1, n) - P(m, n+1).

Table with importance of the next point when the score is m to n

012345678910111213141516171819202122232425
011%11%11%11%10%9%8%7%6%5%4%3%2%1%1%0%0%0%0%0%0%0%0%0%0%0%
111%12%12%11%11%10%9%8%7%6%4%3%2%2%1%1%0%0%0%0%0%0%0%0%0%0%
211%12%12%12%12%11%10%9%8%7%6%4%3%2%2%1%1%0%0%0%0%0%0%0%0%0%
311%11%12%12%12%12%11%10%9%8%7%5%4%3%2%1%1%0%0%0%0%0%0%0%0%0%
410%11%12%12%13%13%12%12%11%9%8%7%5%4%3%2%1%1%0%0%0%0%0%0%0%0%
59%10%11%12%13%13%13%13%12%11%10%8%7%5%4%3%2%1%1%0%0%0%0%0%0%0%
68%9%10%11%12%13%13%13%13%12%11%10%8%6%5%3%2%1%1%0%0%0%0%0%0%0%
77%8%9%10%12%13%13%14%14%13%12%11%10%8%6%5%3%2%1%1%0%0%0%0%0%0%
86%7%8%9%11%12%13%14%14%14%14%13%11%10%8%6%4%3%2%1%0%0%0%0%0%0%
95%6%7%8%9%11%12%13%14%14%14%14%13%12%10%8%6%4%3%1%1%0%0%0%0%0%
104%4%6%7%8%10%11%12%14%14%15%15%14%13%12%10%8%6%4%2%1%1%0%0%0%0%
113%3%4%5%7%8%10%11%13%14%15%15%15%15%14%12%10%7%5%3%2%1%0%0%0%0%
122%2%3%4%5%7%8%10%11%13%14%15%16%16%15%14%12%10%7%5%3%1%1%0%0%0%
131%2%2%3%4%5%6%8%10%12%13%15%16%17%17%16%14%12%9%7%4%2%1%0%0%0%
141%1%2%2%3%4%5%6%8%10%12%14%15%17%18%18%17%15%12%9%6%3%2%1%0%0%
150%1%1%1%2%3%3%5%6%8%10%12%14%16%18%19%19%17%15%12%9%5%3%1%0%0%
160%0%1%1%1%2%2%3%4%6%8%10%12%14%17%19%20%20%18%16%12%8%4%2%0%0%
170%0%0%0%1%1%1%2%3%4%6%7%10%12%15%17%20%21%21%19%16%12%7%3%1%0%
180%0%0%0%0%1%1%1%2%3%4%5%7%9%12%15%18%21%23%23%21%16%11%5%2%0%
190%0%0%0%0%0%0%1%1%1%2%3%5%7%9%12%16%19%23%25%25%22%16%9%3%0%
200%0%0%0%0%0%0%0%0%1%1%2%3%4%6%9%12%16%21%25%27%27%23%16%6%0%
210%0%0%0%0%0%0%0%0%0%1%1%1%2%3%5%8%12%16%22%27%31%31%25%12%0%
220%0%0%0%0%0%0%0%0%0%0%0%1%1%2%3%4%7%11%16%23%31%38%38%25%0%
230%0%0%0%0%0%0%0%0%0%0%0%0%0%1%1%2%3%5%9%16%25%38%50%50%25%
240%0%0%0%0%0%0%0%0%0%0%0%0%0%0%0%0%1%2%3%6%12%25%50%50%50%
250%0%0%0%0%0%0%0%0%0%0%0%0%0%0%0%0%0%0%0%0%0%0%25%50%50%

The values in the table make intuitive sense. If one team is winning by a lot, one more point doesn't make much difference. But if the scores are close, then each point counts. Each point counts a lot more near the end of the game than at the beginning. The first point only makes an 11% difference in the odds of winning, while the if the score is 23-23, the point makes a 50% difference (75% chance of winning if you get the point vs 25% if you miss the point). This table is sort of a derivative of the first table, showing where the values are changing most rapidly.

The importance of a point as defined above closely matches the behavior of the spectators. If the score is very close at the end of the game, the audience becomes much more animated compared to earlier in the game.

The "importance" is mathematically simpler than the probability of winning derived earlier. If the current score is 25-a, 25-b, then the importance is given by the simple equation:

This can proved straighforwardly from the equation for P(x, y). For example, if the score is 18-12, the importance is C(7+13-2, 6) / 2^(7+13-2) = 18564 / 262144 = 7.08%.

Conclusions

How useful is this model? Well, it depends on the assumption that each team has an equal chance of winning each point. Of course, most teams are not evenly matched. Even more important is the fact that if a team has a good server, they can quickly rack up 10 points in a row, which throws the model out the window.

However, I think the model is still useful, since it provides some quantitative answers to the original questions, and confirms some intuitions. In addition, the mathematics turned out to be more interesting than I was expecting, with the surprising connection to Pascal's Triangle.

Python version

P.S. The code above is in Arc, an obscure language. Here's a version of the code in Python that will be more useful:
solved = {} # Remember values that have been solved

# Compute probability of team 1 wining when score is s1 to s2.
# Max is the points needed to win (typically 25)
# This routine is just a wrapper around scorePercentInt to
# remember values that have been computed.
def scorePercent(s1, s2, max):
  if (s1, s2, max) not in solved:
    solved[s1, s2, max] = scorePercentInt(s1, s2, max)
  return solved[s1, s2, max]

# This routine does the actual calculation
def scorePercentInt(s1, s2, max):
  if s1 >= max and s1 >= s2 + 2: return 100
  if s2 >= max and s2 >= s1 + 2: return 0
  if s1 == s2: return 50
  return (scorePercent(s1, s2+1, max) + scorePercent(s1+1, s2, max)) / 2.

for i in range(0, 26):
  for j in range(0, 26):
    print '%.3f' % scorePercent(i, j, 25),
  print